

Debug: the Case of a CPU Burning Ruby Process
September 13, 2020
executor.rb is a little program that starts and finishes other programs based on the needs of the system.
It is expected to have one and only one executor.rb process running with little overhead.
In one of the machines in the lab I found the opposite: two executor.rb instances and one of them running at top speed, consuming 100% of CPU.
For the rest, the system was working properly so one of the executor.rb was doing its job.
But what was the “twin evil” process doing with the CPU?
Ruby stack sampling with rbspy
To get some insight I used rbspy. It profiles a Ruby process sampling its memory, reconstructing the stack and showing which stack traces are the most common executed.
$ sudo ./rbspy record --pid 2331 -d 120 --raw-file data.gz # byexample: +skip
Two minutes of sampling was done for the good and the bad executor.rb processes.
rbspy can also generate flame graphs
$ ./rbspy report -f flamegraph -i data.gz -o out-good.svg # byexample: +skip
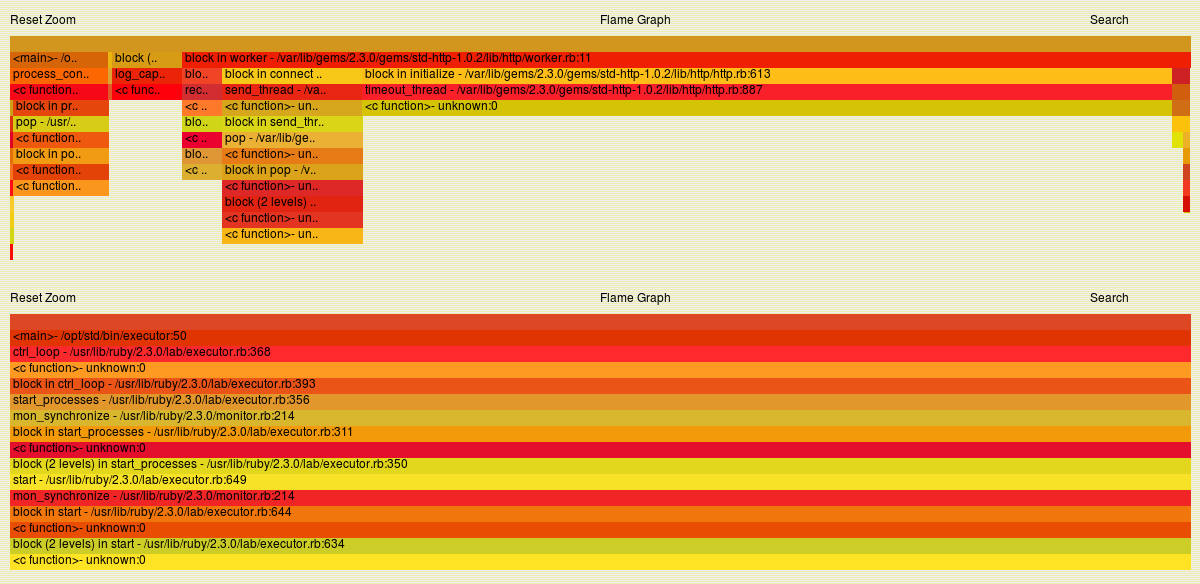
executor.rb, spending most of the time waiting (right side). On bottom, its evil twin with a totally broken call stack.
Unfortunately the call stack of the buggy process makes no sense.
Syscall tracing with strace
It would not be first time that I see a infinite loop calling read(fd, buf, 0)
I rollback to the traditional strace. It slows down quite a bit the debugged process but knowing which syscall is being executed can be of a great help.
$ sudo strace -tt -T -f -p 2331
<...>
[pid 2331] 16:45:05.676271 sched_yield() = 0 <0.000008>
[pid 2331] 16:45:05.676309 sched_yield() = 0 <0.000008>
[pid 2331] 16:45:05.676346 sched_yield() = 0 <0.000008>
[pid 2331] 16:45:05.676383 sched_yield() = 0 <0.000008>
[pid 2331] 16:45:05.676419 sched_yield() = 0 <0.000007>
<...>
sched_yield() is a syscall to “relinquish the CPU”.
The caller thread decides that it cannot make any useful so it tells the OS that it should be moved out of the CPU (move the thread from running to ready) so other threads can use it.
I talk a marginally about this in my other post
I found this syscall in the past to implement a neighbor-friendly busy wait loop. Something like this:
void wait() {
    while (some_condition()) {
        sched_yield();
    }
}
No code in executor.rb was doing such a thing however, I was still missing something.
C stack sampling with Linux perf
And Linux perf filled the blanks.
$ sudo perf top -p 2331                 # byexample: +skip
<...>
34.90%  [kernel]              [k] do_syscall_64
15.37%  [kernel]              [k] syscall_return_via_sysret
 9.08%  [unknown]             [k] 0xfffffe000000601e
 5.89%  [kernel]              [k] pvclock_clocksource_read
 5.06%  [kernel]              [k] __schedule
 2.52%  [kernel]              [k] __raw_callee_save___pv_queued_spin_unloc
 2.45%  libc-2.24.so          [.] __sched_yield
 2.21%  [kernel]              [k] _raw_spin_lock
 2.16%  [kernel]              [k] __entry_trampoline_start
 2.01%  libruby-2.3.so.2.3.0  [.] rb_thread_stop_timer_thread
 1.86%  [unknown]             [k] 0xfffffe0000006000
 1.61%  [kernel]              [k] cpuacct_charge
<...>
The rb_thread_stop_timer_thread is a function of the ruby virtual machine and it was my first suspect.
A search in google completed the story.
Finding the bug with Google and the Open Source Community
A counter is used for signaling between threads and CAS loop for detecting when it is zero yielding the CPU with sched_yield if the condition was not met yet.
native_stop_timer_thread(void) {
    <...>
    while (ATOMIC_CAS(timer_thread_pipe.writing, (rb_atomic_t)0, 0)) {
        native_thread_yield();
    }
    <...>
}
If a fork happen after one thread increments the counter but before someone decrements it, the child process will get stuck waiting for the counter to be zero.
This makes totally sense for executor.rb that main task is to fork and exec other processes.
But I need to be sure that this is the bug.
Confirming the bug with GDB
I attached gdb to ruby process and confirmed the bug.
$ sudo gdb -p 2331                      # byexample: +skip
<...>
0x0000<...> in sched_yield () from /lib/x86_64-linux-gnu/libc.so.6
<...>
(gdb) bt
#0  0x0000<...> in sched_yield () from/lib/x86_64-linux-gnu/libc.so.6
#1  0x0000<...> in native_stop_timer_thread () atthread_pthread.c
#2  rb_thread_stop_timer_thread () at thread.c
#3  0x0000<...> in before_exec_non_async_signal_safe () atprocess.c
#4  before_exec () at process.c
#5  rb_f_exec (argc=<optimized out>, argv=<optimized out>) atprocess.c
<...>
(gdb) frame 2
#2  rb_thread_stop_timer_thread () at thread.c
(gdb) p timer_thread_pipe
$1 = {normal = {3, 4}, low = {5, 6}, owner_process = 0, writing = 1}
With timer_thread_pipe.writing in 1, the CAS loop will never end.
Note that attaching a debugger is quite disruptive as it stops the debugged process; Linux perf and rbspy are much less intrusive and more appropriate for production environments.
Final thoughts
No single tool can always give you the answer and sometimes you need more than tools to solve the puzzle.
You are not alone. People is out there to help you.
But do not relay in google/stackoverflow only: without searching a little from your side generic queries like “ruby program consumes 100% CPU” will lead you to nowhere.
Related tags: performance, debugging, rbspy, perf