

Debugging Lock Free Algorithms
May 16, 2020
Debugging multithread code is hard and lock free algorithms is harder.
What cleaver tricks can we use?
Back to the old good mutex
One simple strategy is to use a traditional mutex or other lock mechanisms to make our lock free code into something much easier to reason about.
Consider a lock free MPMC queue; making it thread safe with a mutex is plain simple:
uint32_t push(data, len) {
    mutex_lock(&mx);
    ...
    if (full)
        mutex_unlock(&mx);
        return 0;
    ...
    mutex_unlock(&mx);
    return n;
}

uint32_t pop(data, len) {
    mutex_lock(&mx);
    ...
    if (empty)
        mutex_unlock(&mx);
        return 0;
    ...
    mutex_unlock(&mx);
    return n;
}
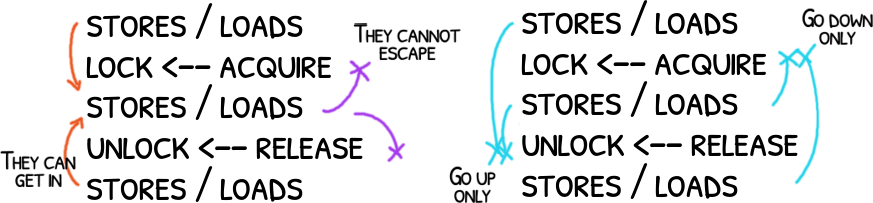
Most? A mutex_lock/mutex_unlock pair works as an ACQUIRE/RELEASE pair: instructions from the critical section (CS) cannot be moved above the lock nor below the unlock but instructions outside of the CS can get into the CS moving from the upside below the lock and from the downside above the unlock
In short, some reorders are still possible: things before and after the CS can get in, things in the CS cannot get out.
What did we get? Most of the possible reorders and subtle race conditions are out.
If you still have a bug then it is more likely to be a classic bug like mistaking < by <= or a missing +1 somewhere –and trust me, you will make this kind of errors too.
Lightweight prints
A buffer of fixed size power of 2 with entries of fixed size simplify the implementation making it faster and less intrusive than a plain printf.
The idea is to have a global shared ring buffer for logs with multiple writers in mind.
To avoid race conditions among the writers, the index is incremented atomically before doing each write. This is another example of a reserve-and-then strategy.
trace(msg)  {
    uint32_t seq = __atomic_fetch_add(&tpos, 1, __ATOMIC_RELAXED);
    uint32_t pos = seq & tmask;

    tbuf[pos].id = thread_id();
    tbuf[pos].seq = seq;
    tbuf[pos].msg = msg;
}
In my previous post we saw that a write may not be visible to others until we need commit.
We don’t do this on purpose: if we add a kind of barrier/memory reorder we may be affecting the code under test and we may masking the bug.
(gdb) set print pretty on
(gdb) p (tpos - 5) & tmask
(gdb) p tbuf[$]@5
Pretty print the last 5 entries.
Anyways the buffer is not read ever –it is a multiple-writers zero-readers buffer. This idea is to read the buffer from a debugger in a synchronous way so we should not have any race condition.
What you read is not what it happen
Consider the following traced code:
trace("foo...");
foo();
You may think that the trace is enough to know when foo() is called.
You may read
thread 1: foo...
thread 2: foo...
but what happen actually was that thread 2 called foo() before the thread 1:
// thread 1                         // thread 2
trace("foo...");
                                    trace("foo...");
                                    foo();
foo();
Interleaving is possible, and no, you cannot use a mutex there.
thread 1: begin foo...
thread 2: begin foo...
thread 2: end foo...
thread 1: end foo...
You may read this but…
Wrapping the code with two traces is a better alternative:
trace("begin foo");
foo();
trace("end foo");
However you still cannot know if thread 1 called foo() before or after the thread 2.
If trace() and foo() are inline, the compiler/CPU may see this:
tbuf[tpos++].msg = "begin foo";
foo_a;
foo_b;
tbuf[tpos++].msg = "end foo";
There is an obvious relationship between the first and the second trace instructions so "begin foo..." happens before "end foo..." but nothing prevents the compiler or the CPU to reorder the inline instructions from foo().
So what could happen is:
// thread 1                         // thread 2
foo_a;
foo_b;
tbuf[tpos++].msg = "begin foo";
                                    tbuf[tpos++].msg = "begin foo";
                                    tbuf[tpos++].msg = "end foo";
tbuf[tpos++].msg = "end foo";
                                    foo_a;
                                    foo_b;
So not only thread 1 called foo() before thread 2 but even after the log entry "end foo" the thread 2 didn’t call foo() at all.
Sorry to say but you don’t have much options and whatever you choose it will affect the precision of the log or it will affect the behaviour of you code under debug.
Automated tools
This would be the holy grail but we are still far from a tool to detect race conditions in general.
Thread Sanitizer, also known as tsan, goes in that direction.
Helgrind has been for a while too.
This is a huge area to explore…
Code
Take at look how loki library’s debug facilities are implemented. It humbly supports tracing, mutexes and a compiled version with tsan.
Alternative methods are welcome!!
References
- Jeff Preshing’s lightweight logging
- Shameem Akhter and Jason Roberts’ multithreading debugging techniques
References were taken on May 1st.
Related tags: performance, lock free, data structure, debugging