

Reds and Blues Architecture
September 9, 2020
Could we design an architecture that allows us to have insight about the performance of the system?
When you spend nights debugging searching where is the bottleneck, it is when you blame the you of the past for a so opaque and slow architecture.
This is the proposal of a simple architecture that allows introspection and enables – too many times forgotten – basic optimizations.
A case of study
Imagine that we need to accept requests from a client and forward them to a server.
The server will do the real job and it will return us the result of the operation that we will store in a database.
But the server is stateful and processing the same request twice will corrupt the server.
It is our job to filter the duplicates out.
For that we use the same database to query if the given task was already seen or if it is a novel one.
The following pseudo-code shows the proposed solution:
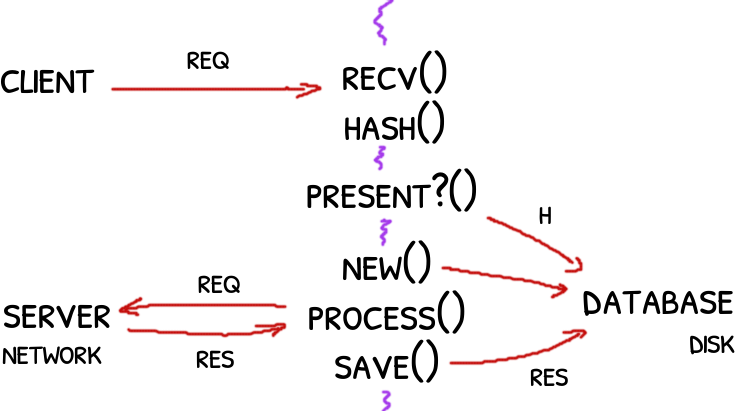 Original design: a little messy with IO mixed with CPU bounded code.
def main():
    req = client.receive_request()
    h = calculate_hash(req)

    if database.is_present(h):
        return # nothing else, drop duplicated

    database.create_new_request(h, req)

    res = server.process_request_and_get_result(req)
    database.save_result(h, res)
When we stress the code we found that it is just not fast enough.
The code uses different resources and all of them need to be up to the task.
Because there is no separation between them, it is hard to know where is the bottleneck.
Reds and Blues
We can refactor the code into several threads allowing each to interact with a single resource.
In particular we want to distinguish which threads do IO operations and which don’t.
The threads will communicate each other with queues.
The objective is not to run code concurrently to booster the speed but to make explicit the implicit.
And the queues will provide us that insight.
But first, this is the diagram of the refactored code:
Each thread and arrow is colored: reds for IO code and blues for CPU code.
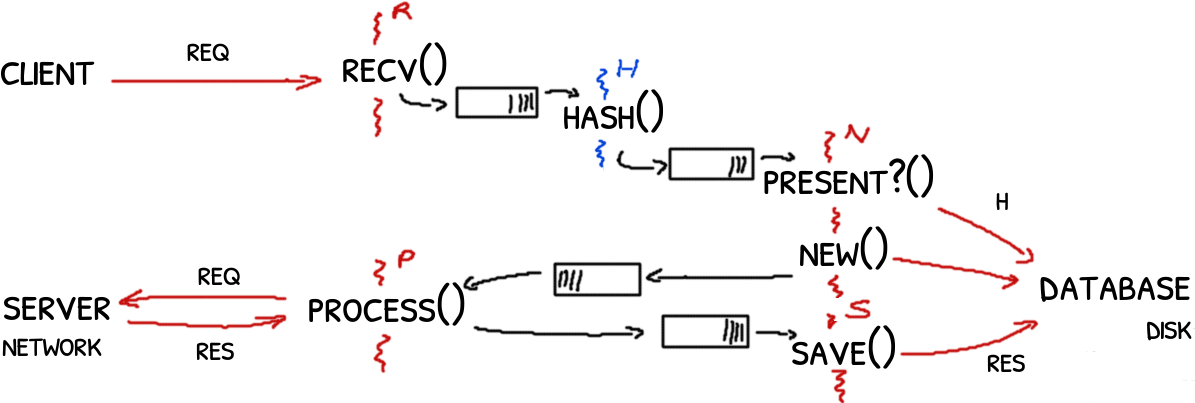
Consider the queue between the thread that receives the requests (R) and the thread that calculates the hash of it (H).
If the queue starts to fill up that would mean that or we are receiving too many requests or that the hash is taking more than than expected.
The queue does not tell exactly where is the problem but cuts and reduces the search area.
Some other examples:
- if the threads N’s and S’s queues are getting full, that may indicate a problem with the database. Slow queries? Slow disk?
- if instead the thread P is the bottleneck, then the server is the problem. Slow network? Too chatty protocol? A server-side problem?
The queues
To make any insight the queues must track:
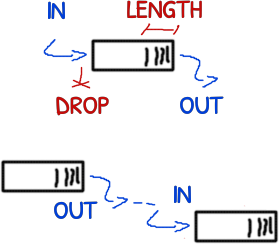 Metrics: in and out over time, plus drops and queue’s length. When two queues are connected, one of the metrics can be deduced from the other.
- items pushed into the queue over time (throughput of the producer)
- items popped from the queue over time (throughput of the consumer)
- the occupancy of the queue (also known as the length of the queue)
- items dropped due the queue was full
In a architecture where there are multiple queues, it is generally redundant to have a count of the items pushed and the items popped.
We could track only the items pushed and use that metric for the exit queue to estimate the items popped from the enter queue.
For example, if the thread H is pushing 10k items per second in the exit queue (that connects H with N), we can conclude that H is popping 10k items per seconds from its enter queue (that connects R with H).

For analyzing the performance Brendan Gregg’s USE method states that every resource must be characterized by three metrics:
- utilization: average time that the resource was busy
- saturation: degree of extra work that the resource didn’t handle, often queued
- errors: well, that, errors, like drops.
There are two categories of resources that differ in the definition of utilization:
- IO resources, like network, disk: the utilization is the amount of time that the resource was busy.
- Capacity resources, like the memory: the utilization in this case is the amount of memory in use.
This is more generic way to analysis the performance of a system: using queues for statistics is a particular case.
But there is more…
Batch/Bulk for free
 Each message requires an encapsulation header and a syscall to send it. Costs that you may per message; more messages means more you pay.
The explicit queues allows to delay the processing but in exchange they allow to process the items in batch or bulk operations.
A classic example would be the database: instead of querying each time we could query every 1k items doing a single bulk operation.
For example, we could save 1k results in a single operation.
This not only save bandwidth with the database but also IO operations.
 Less is more. Also it enables specific per-bundle compression.
The communication with the server could be also improved. Instead of sending a request per work item, we could send them in packs: less messages going back and forward through the network it is always a good deal.
Less chatty communication means more time and space for the real data, a better channel utilization.
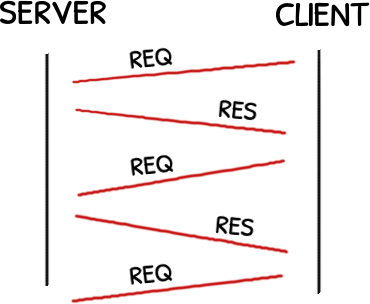
Asynchronous for free
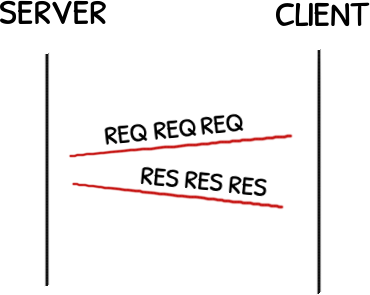
And talking about network, sending a request and waiting for the response is incredible slow.
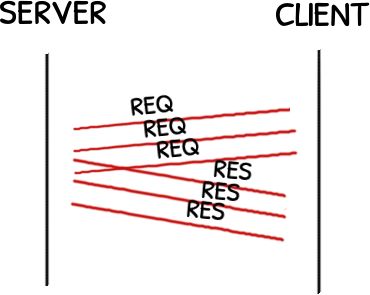 While a bulk calls amortize the cost per message, asynchronous calls make more use of the capacity of the network so you can send more in the same time.
We can send the requests asynchronously to the server without waiting for the responses, and receive them later.
This is perfectly possible because we put queues between who trigger the request (N) and who do something with the response (S).
The architecture supports asynchronous mechanisms out of the box.
Everything is violet
We categorized the threads in threads with high IO and threads with high CPU but it is important to highlight the fact that all the threads are running in the same machine with shared resources.
A CPU thread could end up doing a lot of IO because the system ran out of memory and it is swapping.
A IO thread that sends requests to the network may use a lot of CPU because the serialization of the request is expensive.
The queues provide insight but they must be taken as a complement of other metrics of the system.
At the end, everything is tainted with reds and blues.